Lesson 3: How to Write a Result Section of a Chemistry Lab Report

The
result section of a chemistry lab report is where you present your results. You
can present your results in the form of tables, graphs, and diagrams. Tables,
graphs or diagrams must be labeled correctly. You can write a brief description
on either top or below of the tables, graphs, and diagrams. However, labeling
of your tables and figures depend on the instructions provided by your
institution.
In
addition, you have to briefly describe your results. Though, you should not explain
your results in this section. The explanation of your results should be in your
discussion part.
Let us check a few examples:
Example
1
An
experiment was conducted to determine the concentrations and the acid-base equilibrium
constants for acetic acid and aqueous ammonia using titration curves. During
the lab session, the following raw data for titration of an acetic acid with sodium
hydroxide, and titration of aqueous ammonia with hydrochloric acid, CLICK HERE TO FIND THE DATA .
You
have to express these results in a neat and pretty form. The results are
already in MS Excel. Now, you have to use Scatter plot on the MS Excel Tool's
Bar to draw titration curves using your raw data. For titration of an acetic
acid with sodium hydroxide, plot pH values against the volume of sodium
hydroxide used. For the titration of aqueous ammonia with hydrochloric acid,
plot pH values versus the volume of hydrochloric acid used.
If
you do that, you will get these curves: acetic acid-sodium hydroxide titration
curve and aqueous ammonia-hydrochloric acid titration curves, CLICK HERE TO FIND THE CURVES .
Now,
present them in your lab report as in Figure 1 and Figure 2.
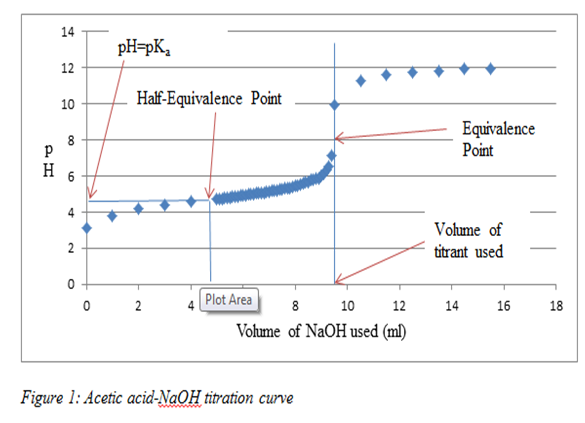

Briefly
describe your data for example 1 as follows:
The volume of NaOH used
to reach equivalence was 9.3ml and the pKa was 4.3. On the other
hand, the volume of HCl used to reach equilibrium was 16.4ml and pKb
was 9.57.
Example 2
An experiment was performed to identify
two unknown compounds by interpreting their IR spectra. In this example, IR
spectrometer was used, which gave two spectra of the two unknown compounds
(Figure 1 and Figure). Figure 1 is the IR spectrum of unknown compound #1 while
Figure 2 is the IR spectrum of unknown compound #2. Additionally, Table A
consists of structure, functional group, peak and the identification of unknown
organic compounds.
 | ||||||
| Figure 1: IR Spectrum of Unknown Compound #1 |
 |
| Figure 2: IR Spectrum of Unknown Compound #2 |
 |
| Table A |
Briefly
describe your data for example 2 as follows:
The unknown organic
solution #1 had C=O vibrational stretch peak at 1714cm-1(Figure 1
and Table 1). On the other hand, unknown organic solution #2 had both C=O and
C-O vibrational stretches at 1714cm-1 and 1269cm-1(Figure
2 and Table 1). These results indicate that among the lists of organic
compounds available only aliphatic ketone and aromatic ester were present.
Final remarks:
In a chemistry lab result section, you
should present your data in a proper manner. Label them as required and with
captions either on top or below. Furthermore, briefly describe your results and
use the correct measurements when it is required. In examples 1 and 2 above, I presented my data in graphs, tables, and
diagrams. Therefore, it is easier for the reader to understand my data even
without reading a brief description of the results.
If you have any question about this
lesson, kindly comment below and I will answer it.Moreover, if you have not checked previous posts then you can read them here,Free Course , Lesson 1, and Lesson 2.


Comments
Post a Comment